Logging and monitoring
In this exercise, we'll explore the out-of-the-box logging and monitoring capabilities that are offered in OpenShift.
Simulate Load on the Application
Let's simulate some load on our application.
First, make sure you're connected to the project where you deployed your app.
oc project example-healthRetrieve the public route to access your Example Health application:
oc get routesOutput looks similar to this (remember not to copy this exact host):
 NAME         HOST/PORT                                                                                                 PATH      SERVICES     PORT       TERMINATION   WILDCARD
 patient-ui   patient-ui-example-health.roks07-872b77d77f69503584da5a379a38af9c-0000.eu-de.containers.appdomain.cloud             patient-ui   8080-tcp                 None
Run the following script which will endlessly spam our app with requests:
With Linux/MacOS:
while sleep 1; do curl -s http://<host>/info; doneWith Windows:
while($true){curl http://<host>/info}
We're hitting the /info endpoint which will trigger some logs from our app. For example:
http://patient-ui-health-example.myopenshift-xxx.us-east.containers.appdomain.cloud/info
OpenShift Logging
Since we only created one pod, seeing our logs will be straight forward.
Ensure that you're in the Developer view. Then, navigate to Topology.
Navigate to your Pod by selecting your app, then clicking the name of the Pod under Pods.
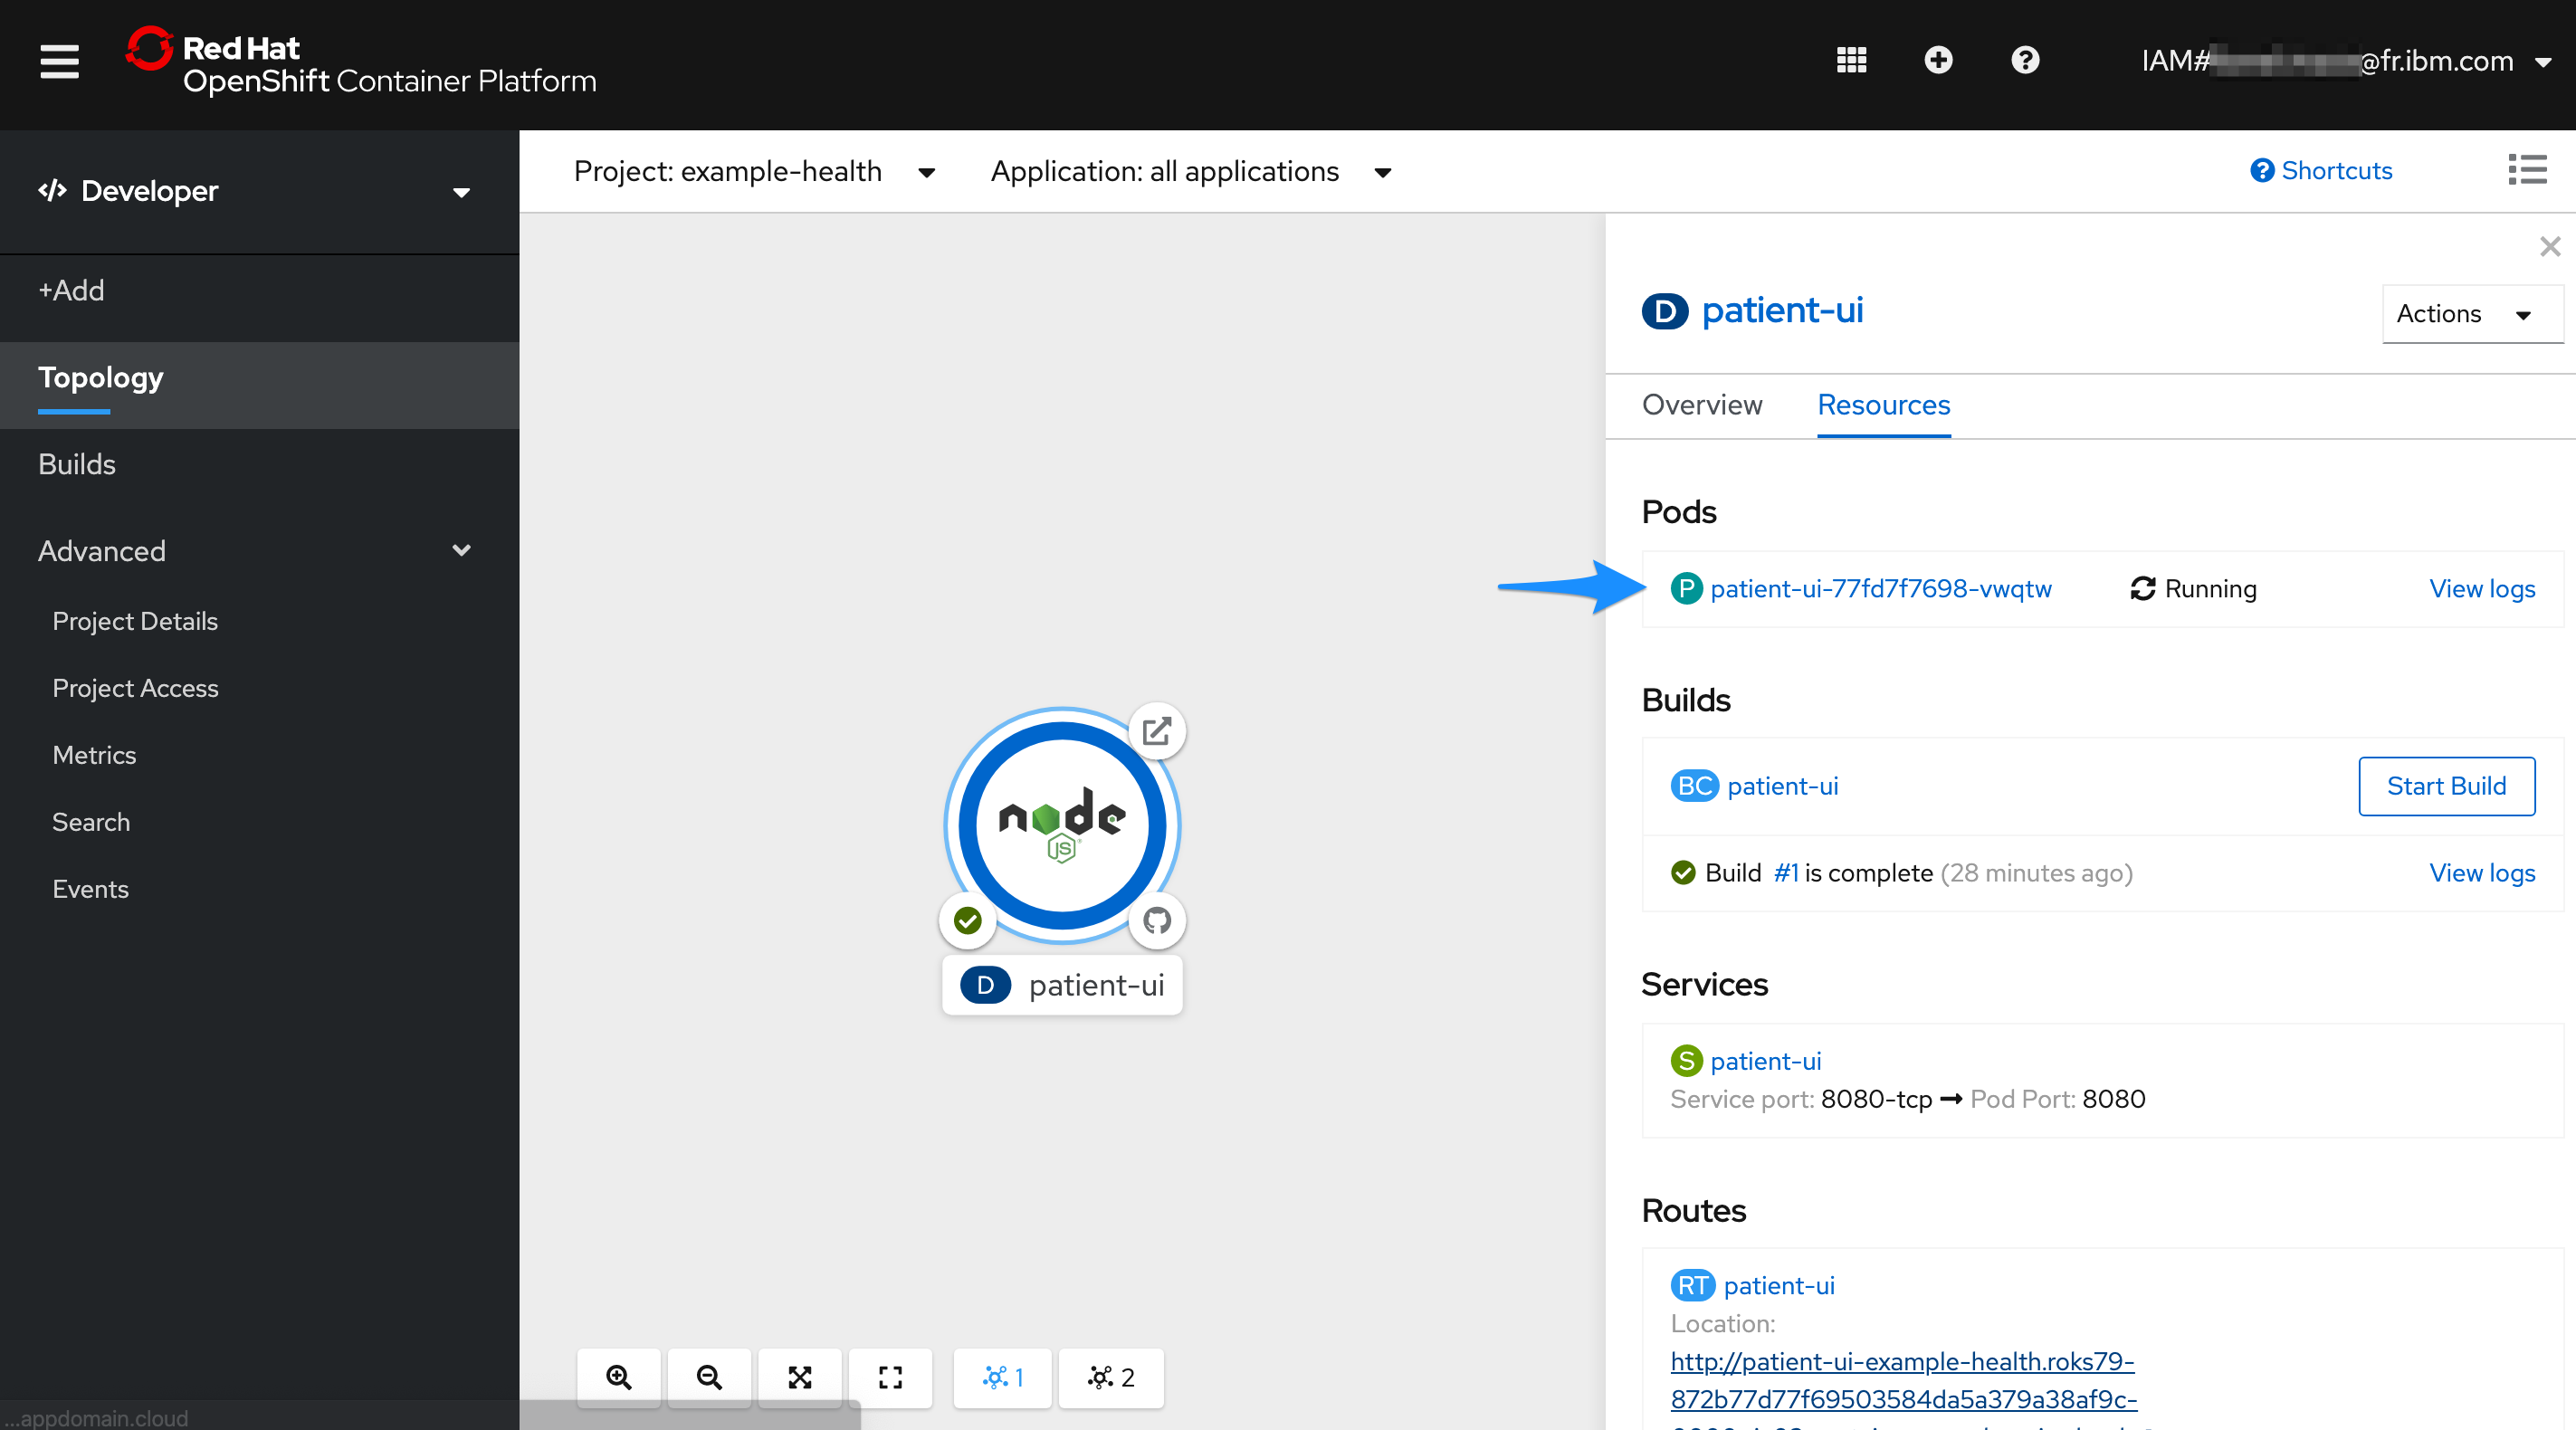
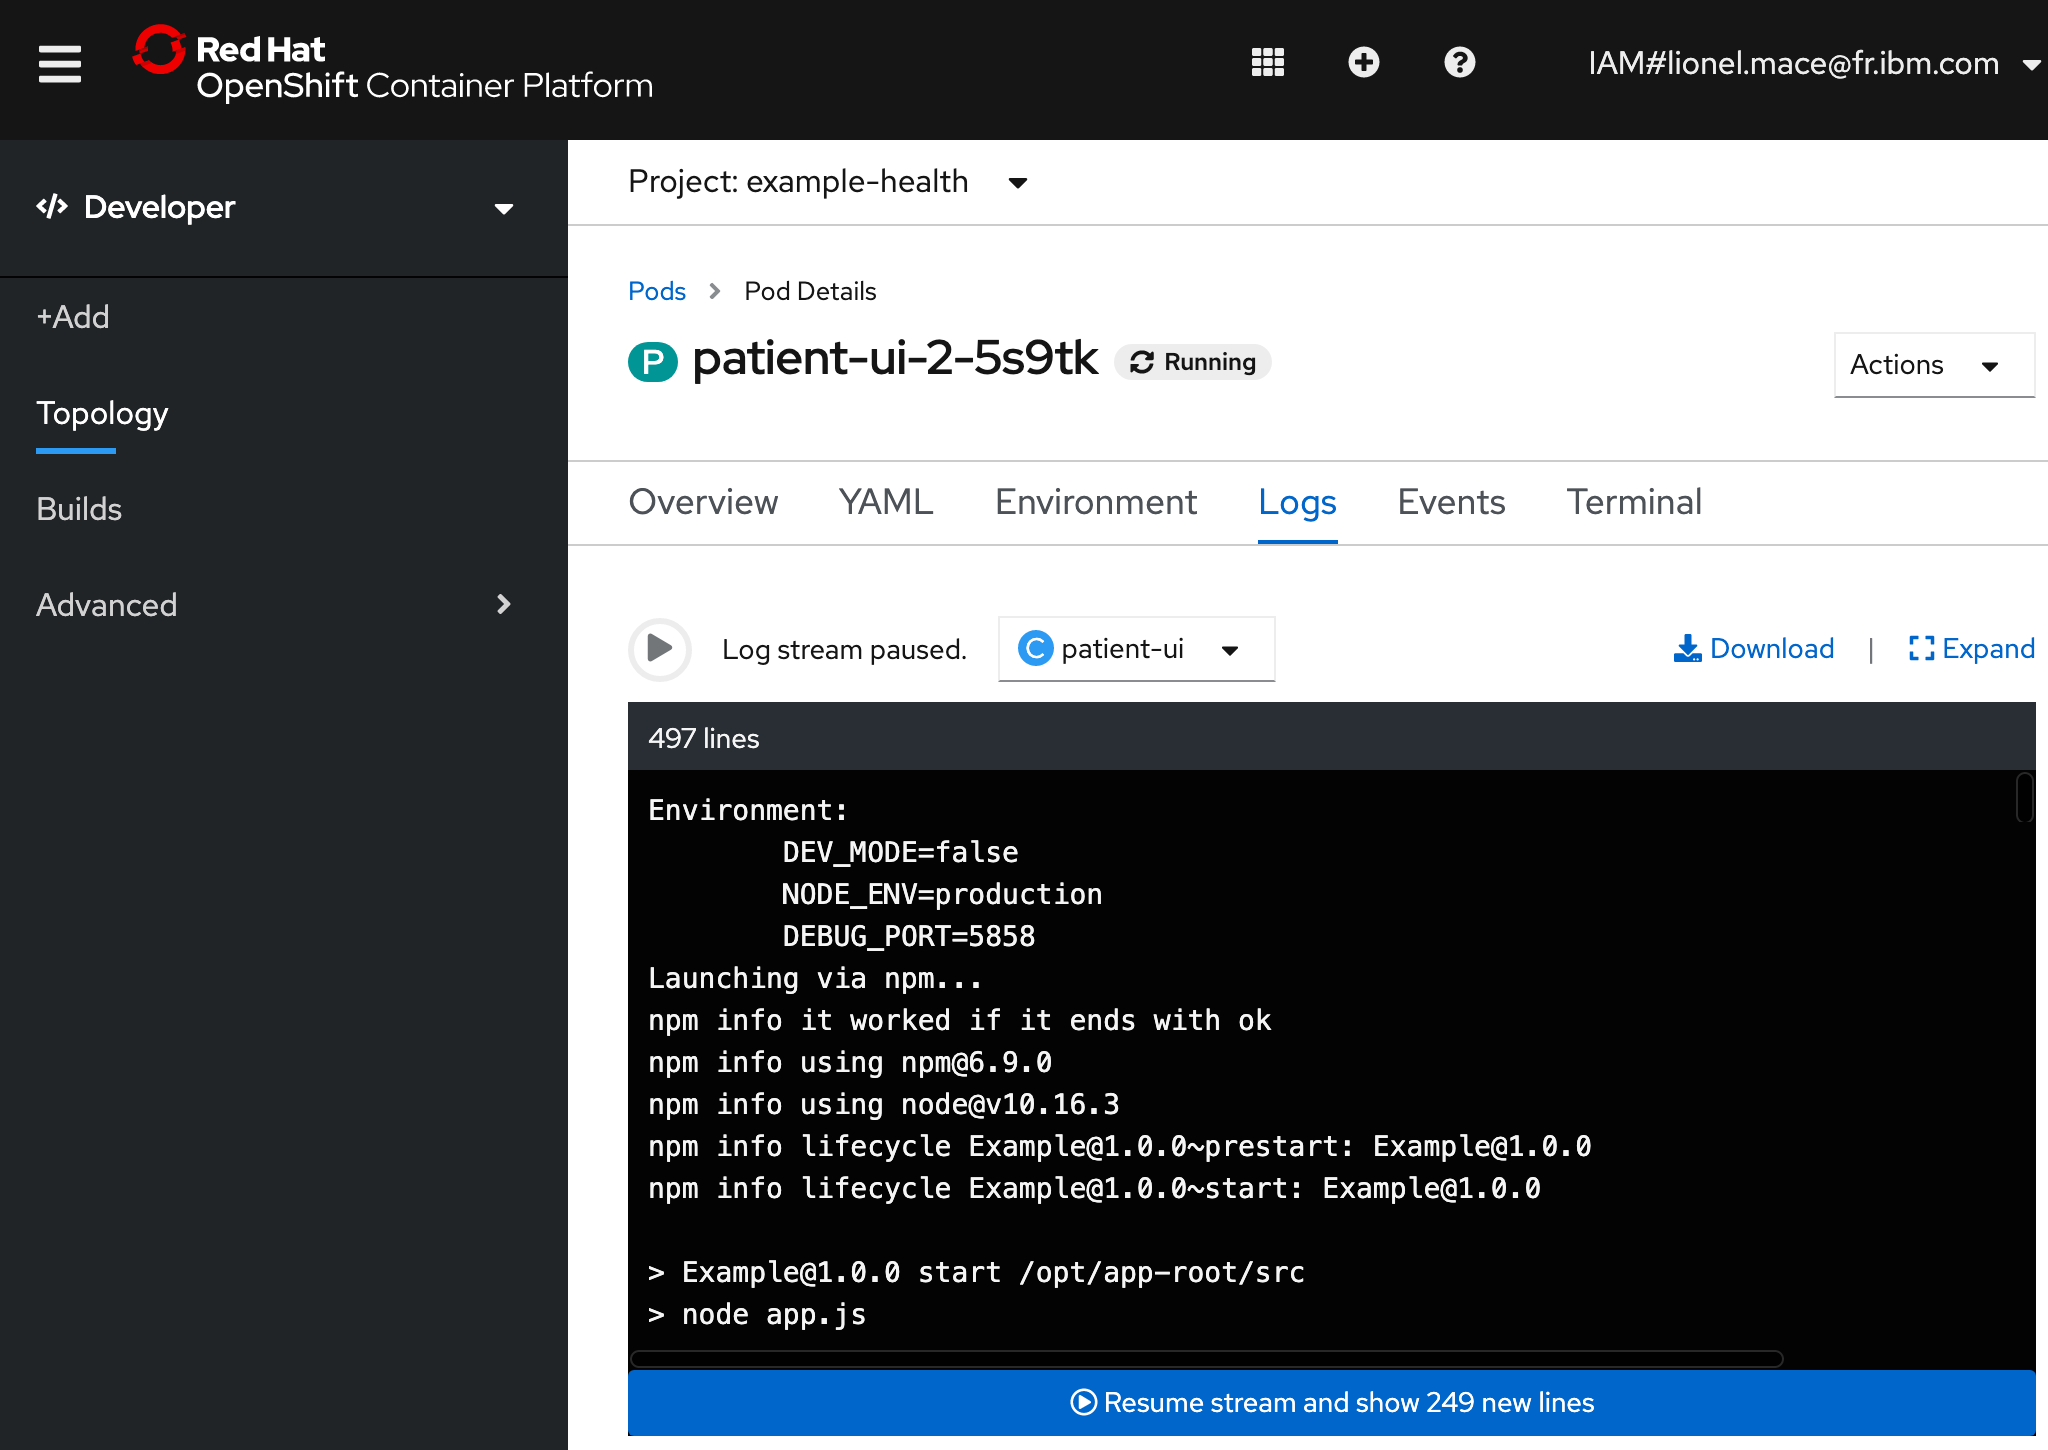
Click on View Logs next to your Pods to see streaming logs from your running application. If you're still generating traffic, you should see log messages for every request being made.
OpenShift Terminal
One of the great things about Kubernetes is the ability to quickly debug your application pods with SSH terminals. This is great for development, but generally is not recommended in production environments. OpenShift makes it even easier by allowing you to launch a terminal directly in the dashboard.
Navigate to your Pod by selecting your app, then clicking the name of the Pod under Pods.
Switch to the Terminal tab
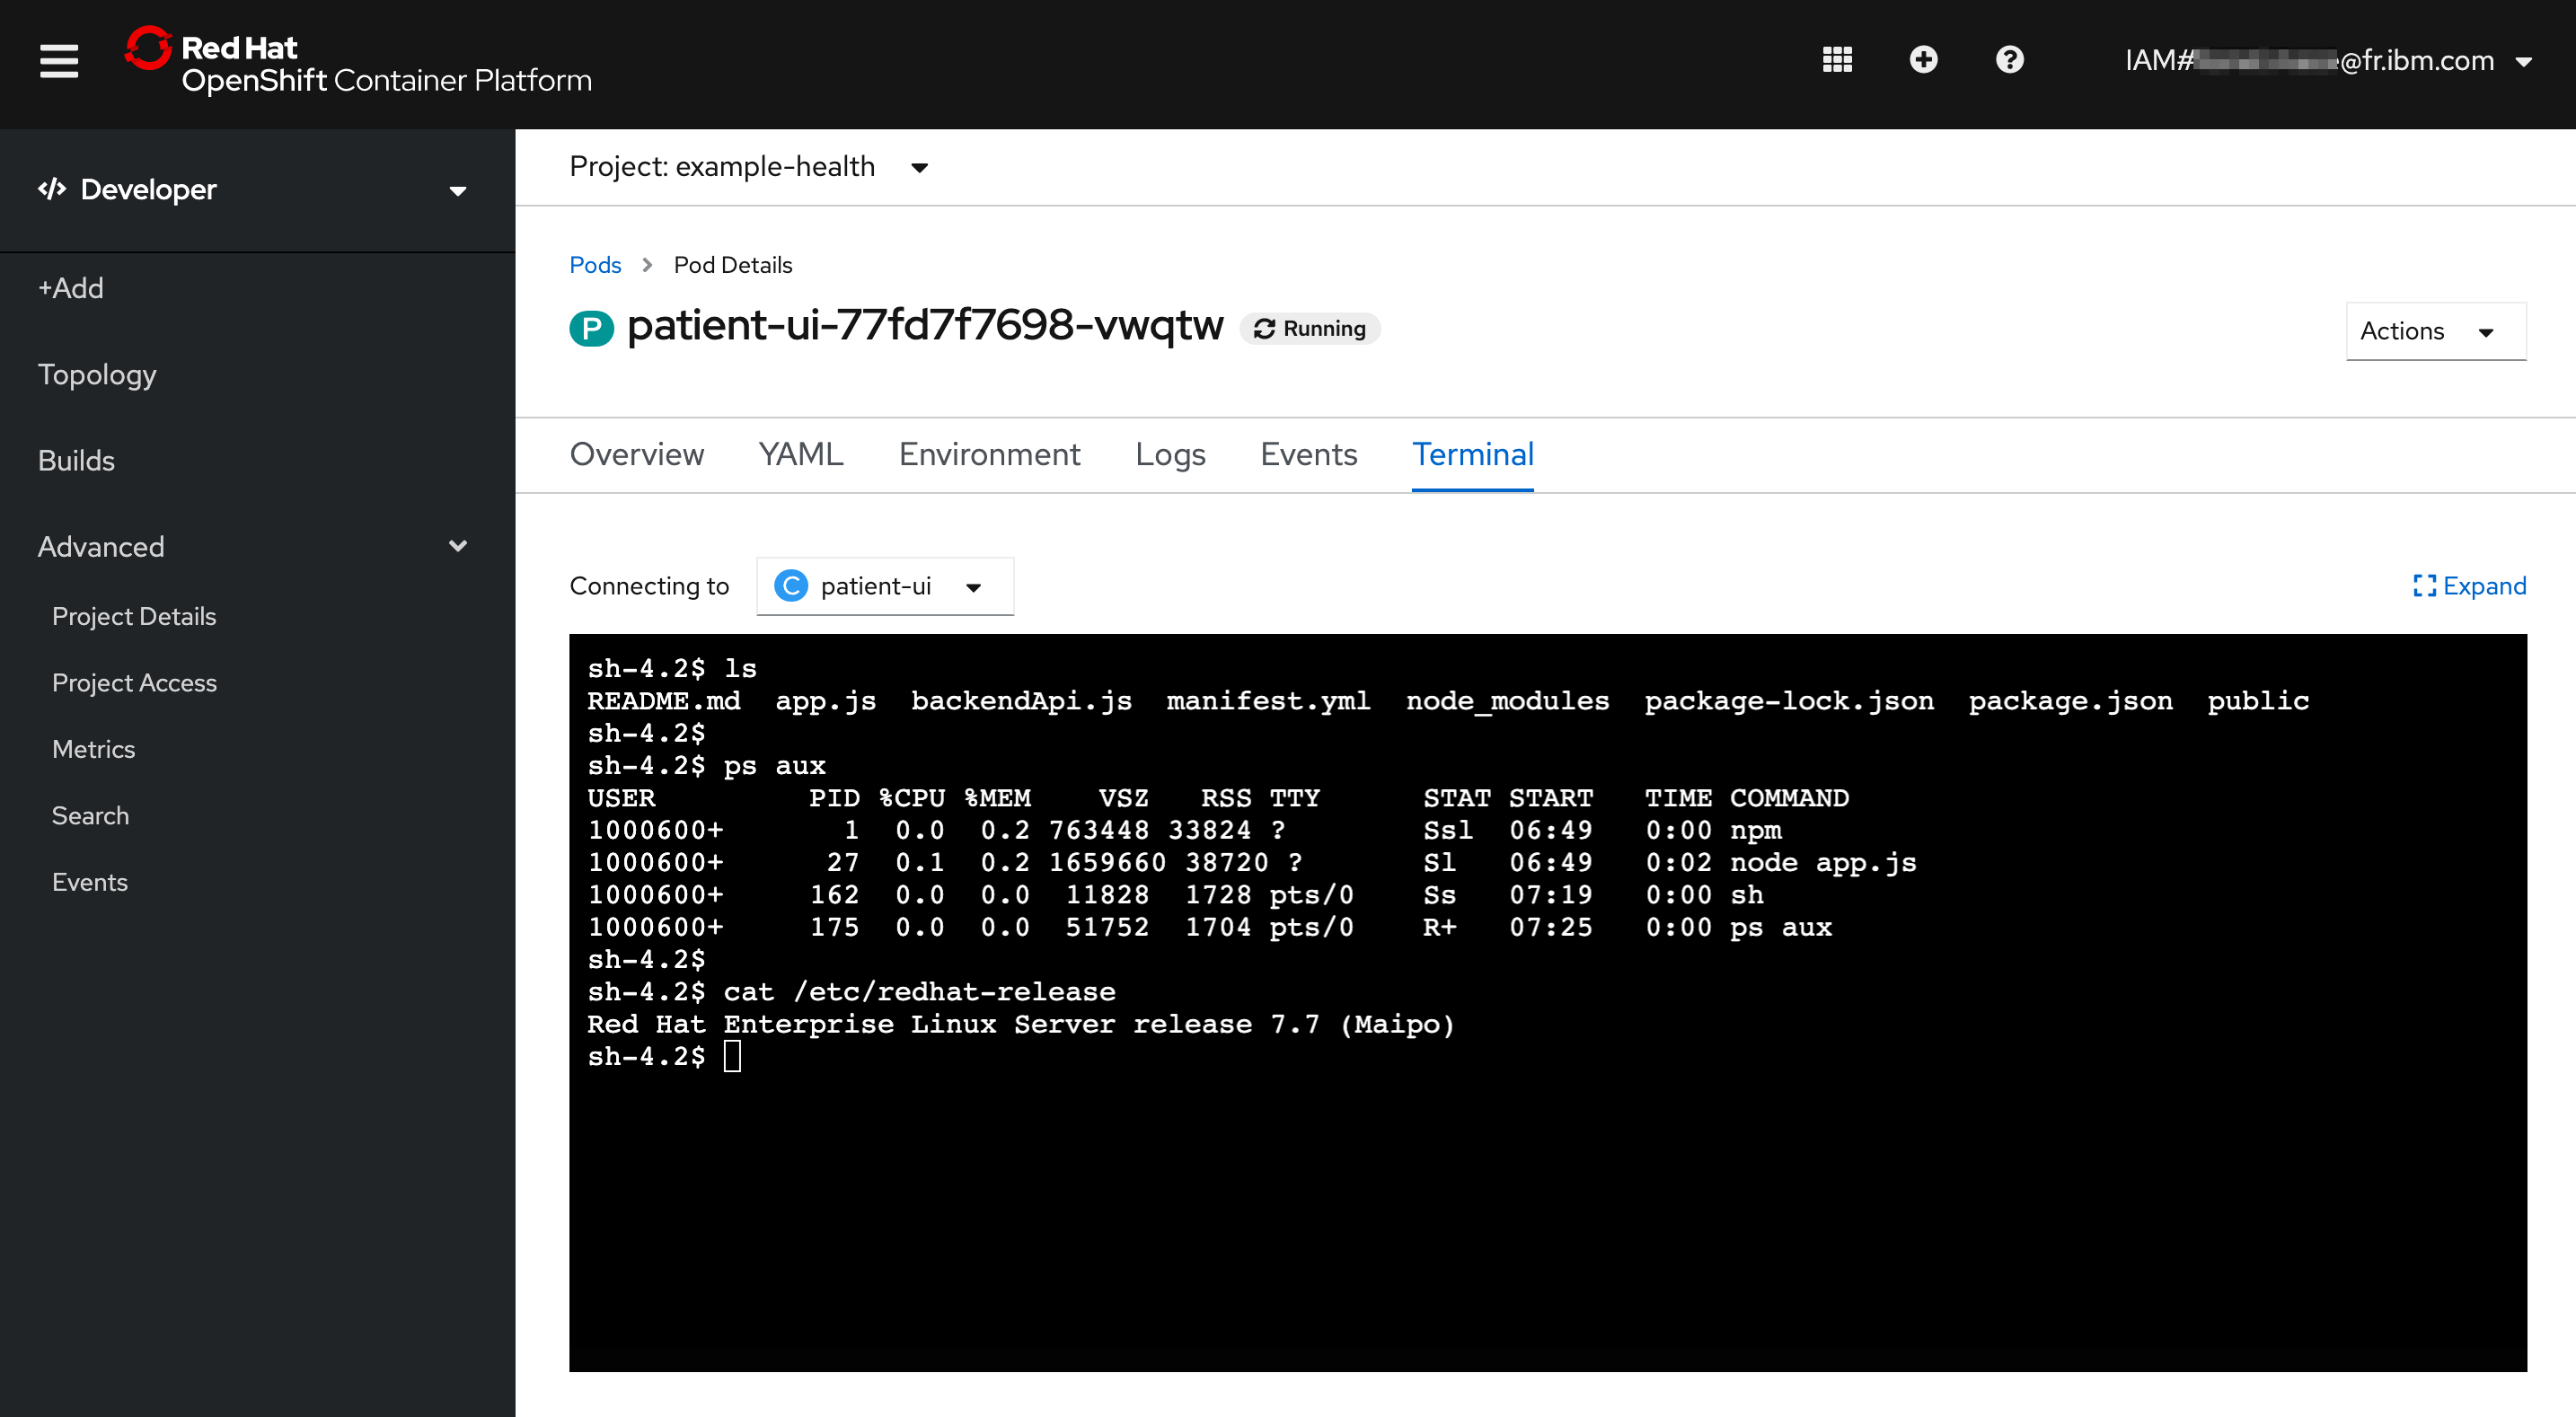
Run the following Shell commands:
| Command | Description |
|---|---|
| ls | List the project files. |
| ps aux | List the running processes. |
| cat /etc/redhat-release | Show the underlying OS. |
OpenShift Monitoring
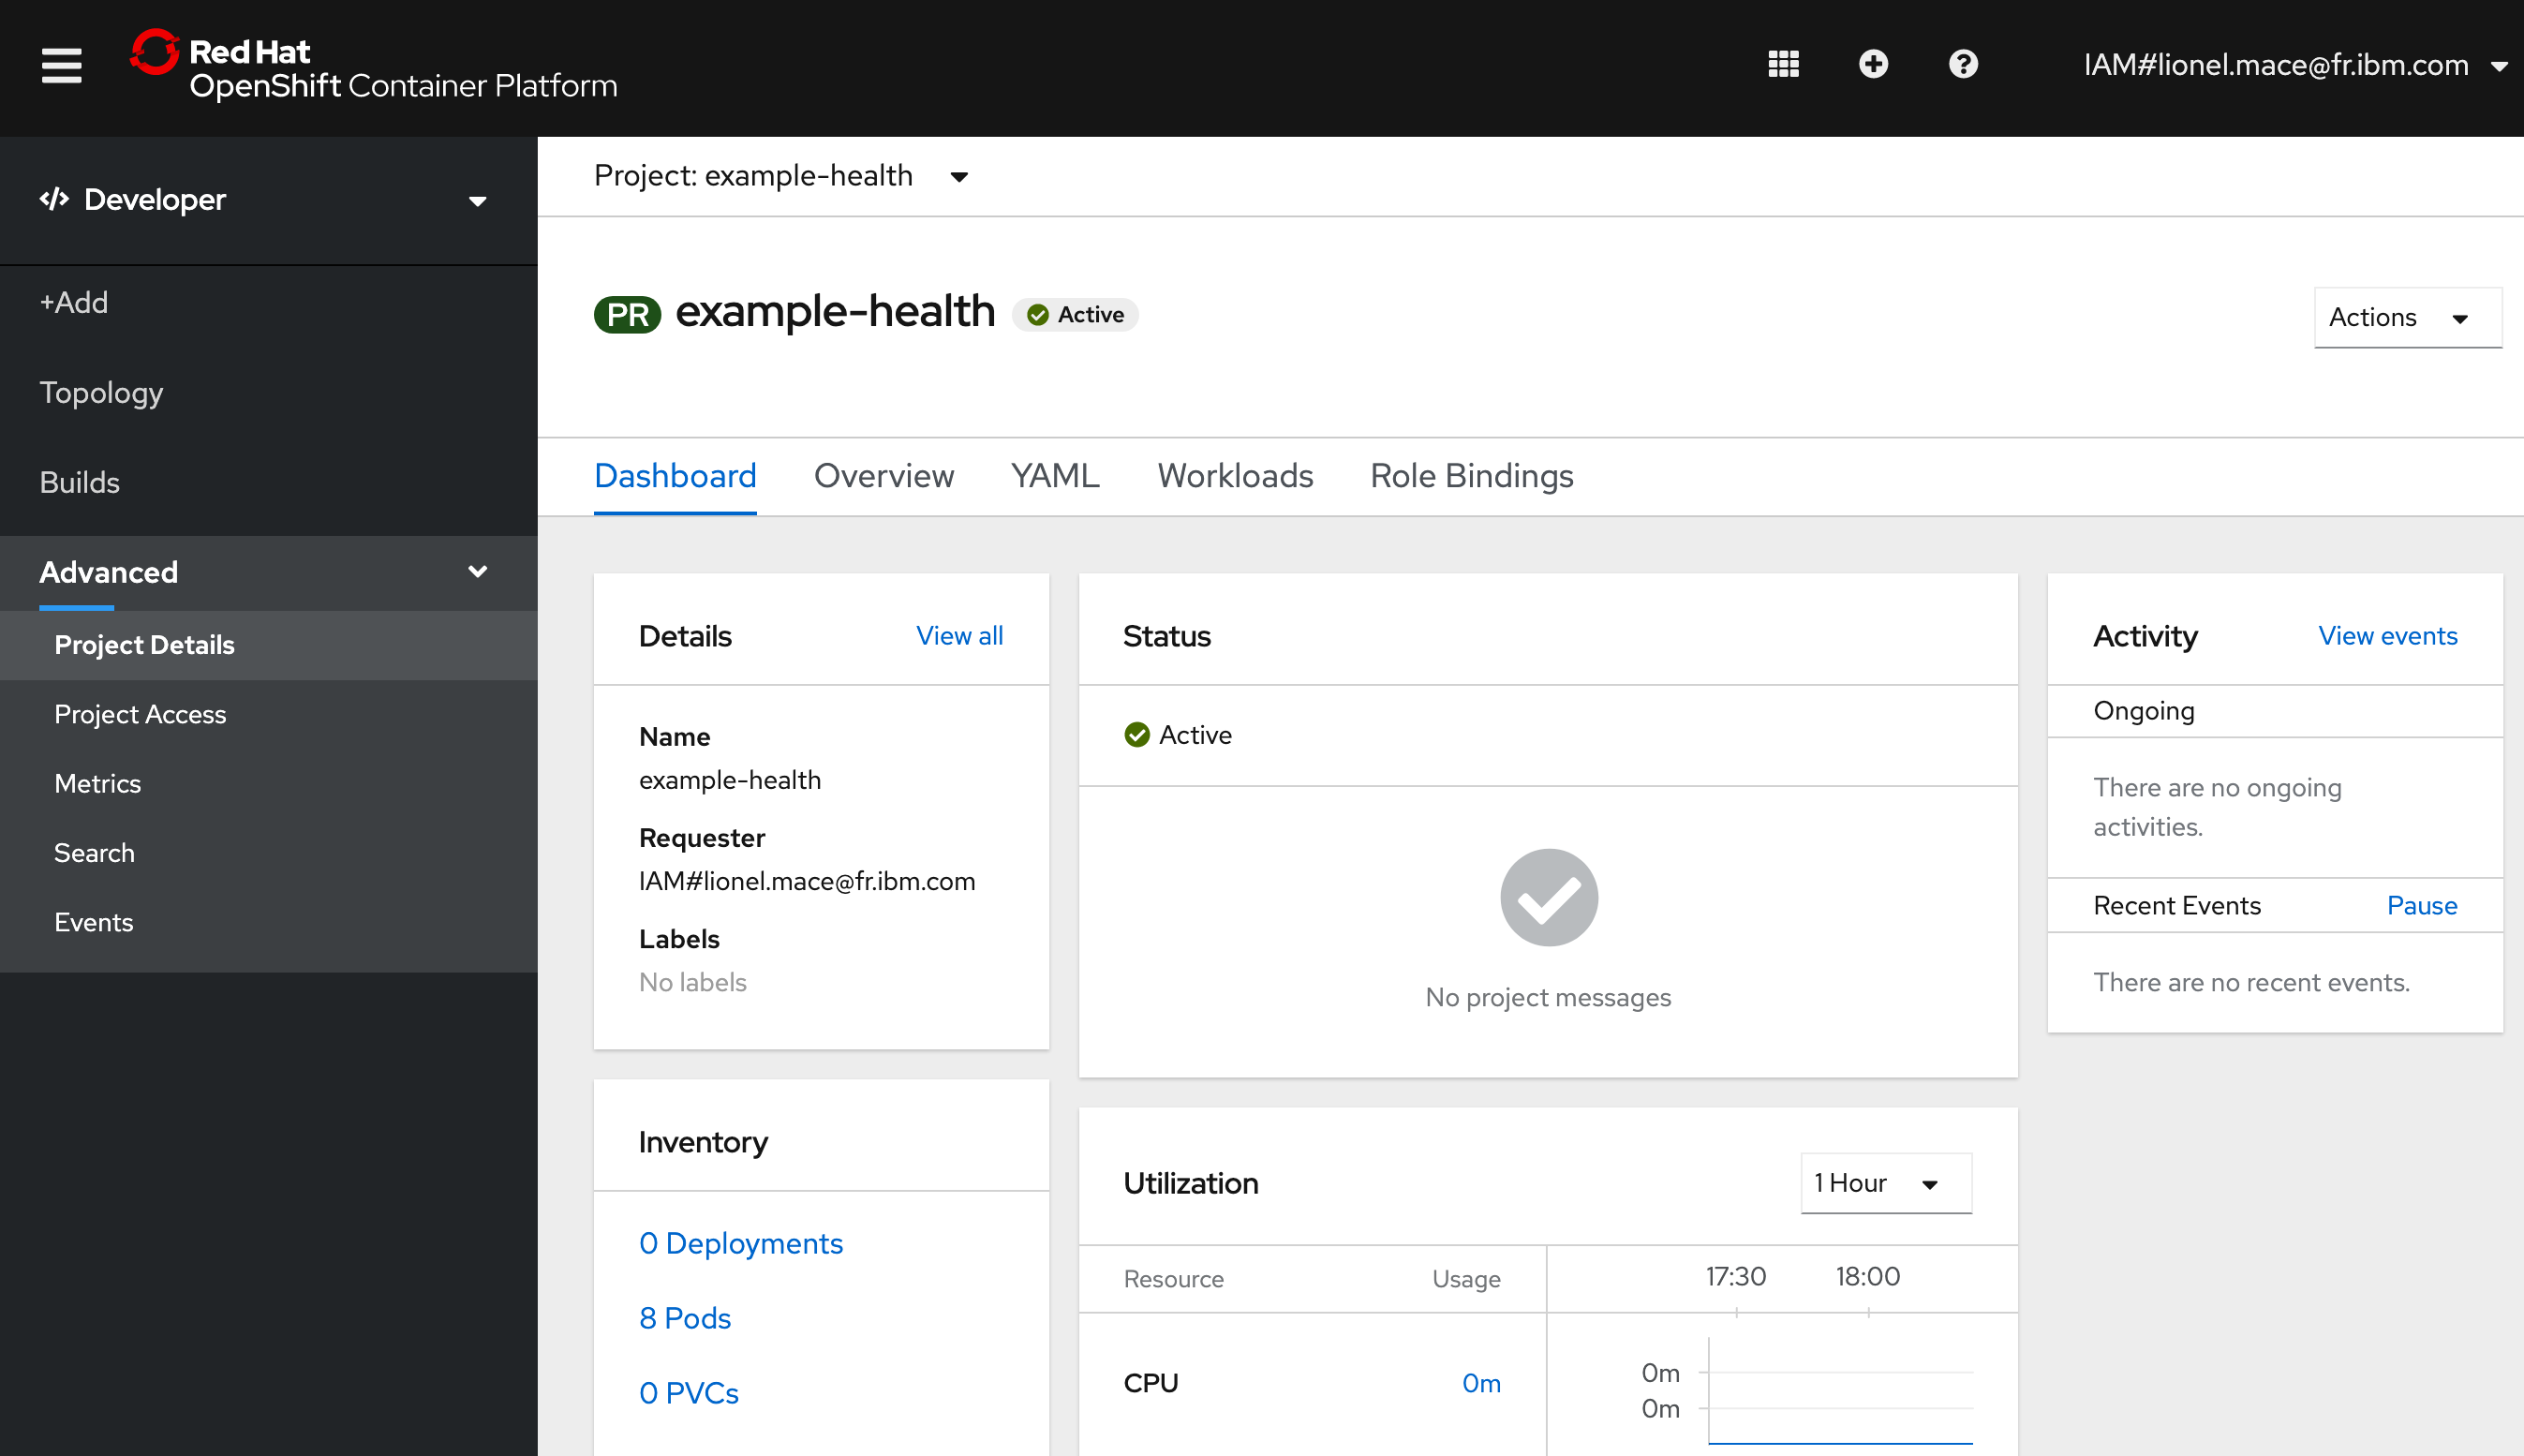
When deploying new apps, making configuration changes, or simply inspecting the state of your cluster, the Project-scope Dashboard gives Developer Clear Insights.
Access the Dashboard now by going to the Advanced > Project Details tab on the left side menu.
You can also dive in a bit deeper - the Events view is useful for identifying the timeline of events and finding potential error messages. When tracking the state of a new rollout, managing existing assets, or even something simple like exposing a route, the Events view is critical in identifying the timeline of activity. This becomes even more useful when considering that multiple operators may be working against a single cluster.
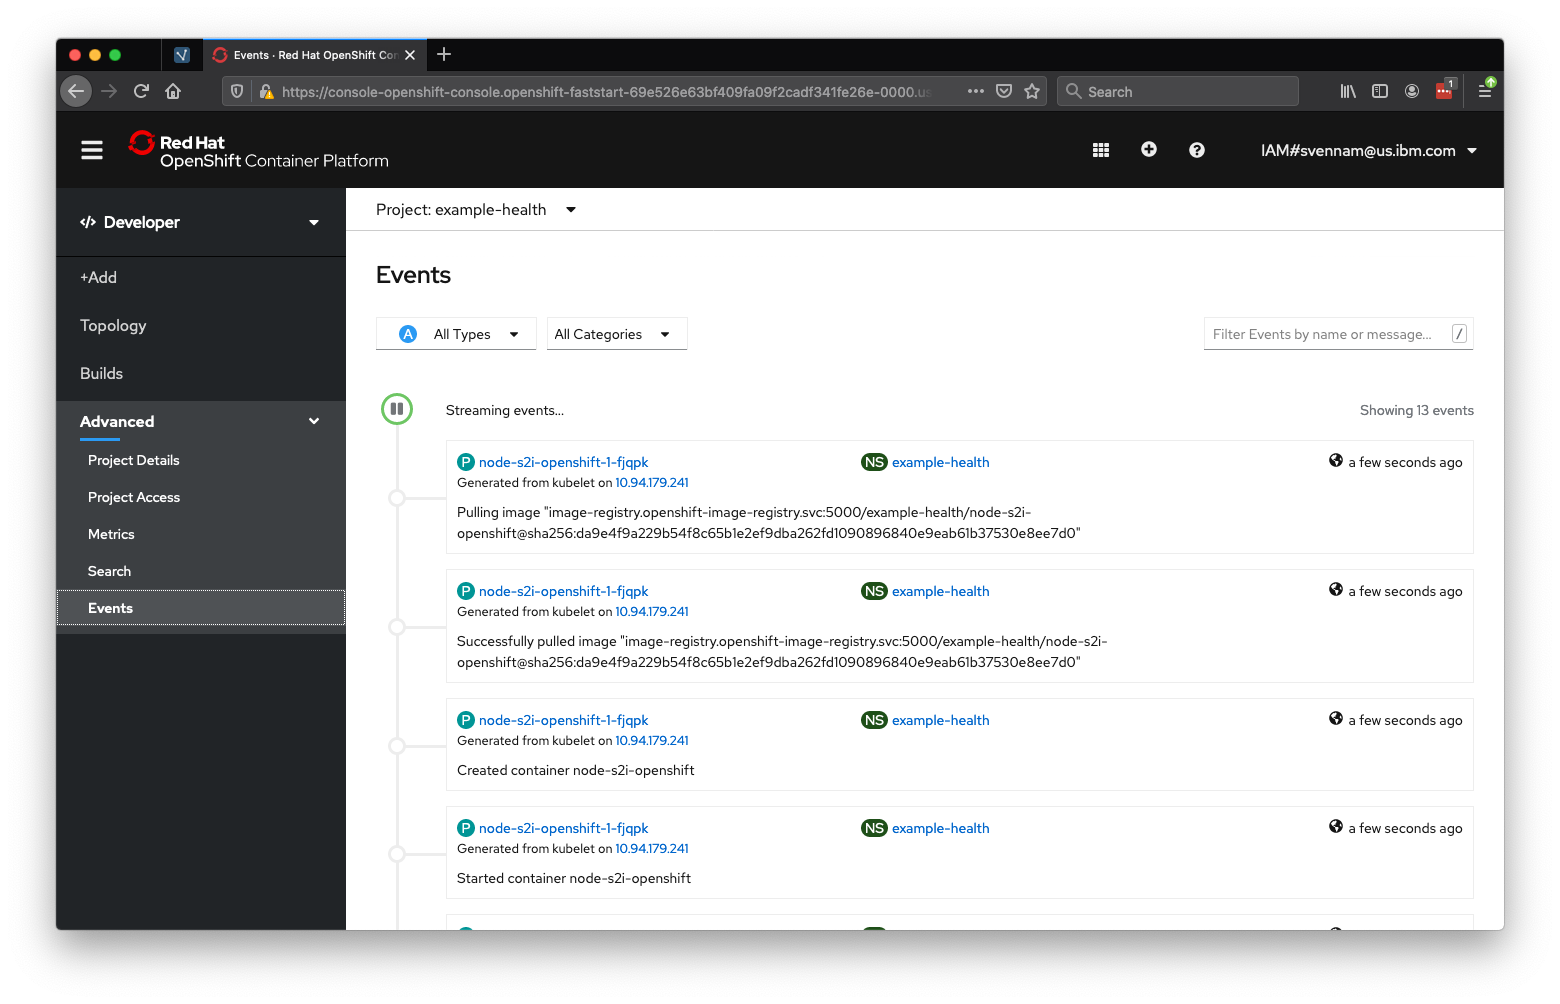
You'll want to refer to this view throughout the lab. Almost all actions we take in in OpenShift will result in an event being fired in this view. As it is updated real-time, it's a great way to track changes to state.