Configure LogDNA agent for OpenShift cluster
The LogDNA agent is responsible for collecting and forwarding logs to your IBM Log Analysis with LogDNA instance. After you provision an instance of IBM Log Analysis with LogDNA, you must configure a LogDNA agent for each log source that you want to monitor.
To configure your Kubernetes cluster to send logs to your IBM Log Analysis with LogDNA instance, you must install a LogDNA-agent pod on each node of your cluster. The LogDNA agent reads log files from the pod where it is installed, and forwards the log data to your LogDNA instance.
If you've been invited to a lab account where an instance of LogDNA has already been provisioned and configured, skip the create and deploy steps and go to verify the agent at the bottom. Retrieve your LogDNA instance be looking at the cluster name in the tags attached to the instance.
Create a Sysdig service instance
- Create an instance of IBM Cloud Logging with LogDNA from the catalog:
- Set the Service name to YOUR_IBM_ID-logdna.
- Select the location where your cluster is created. If the location is not in the list, pick the closest region (e.g. us-south).
- Use the default resource group.
- Click Create.
- In the Observability category, under Logging, locate the service instance you created.
Deploy the LogDNA agent in the cluster
On your instance, click Edit log sources.
Before running the curl command in the next step, make sure you're still logged in to the cluster. Access your cluster using the oc CLI.
Select the OpenShift tab and run the 5 steps command:
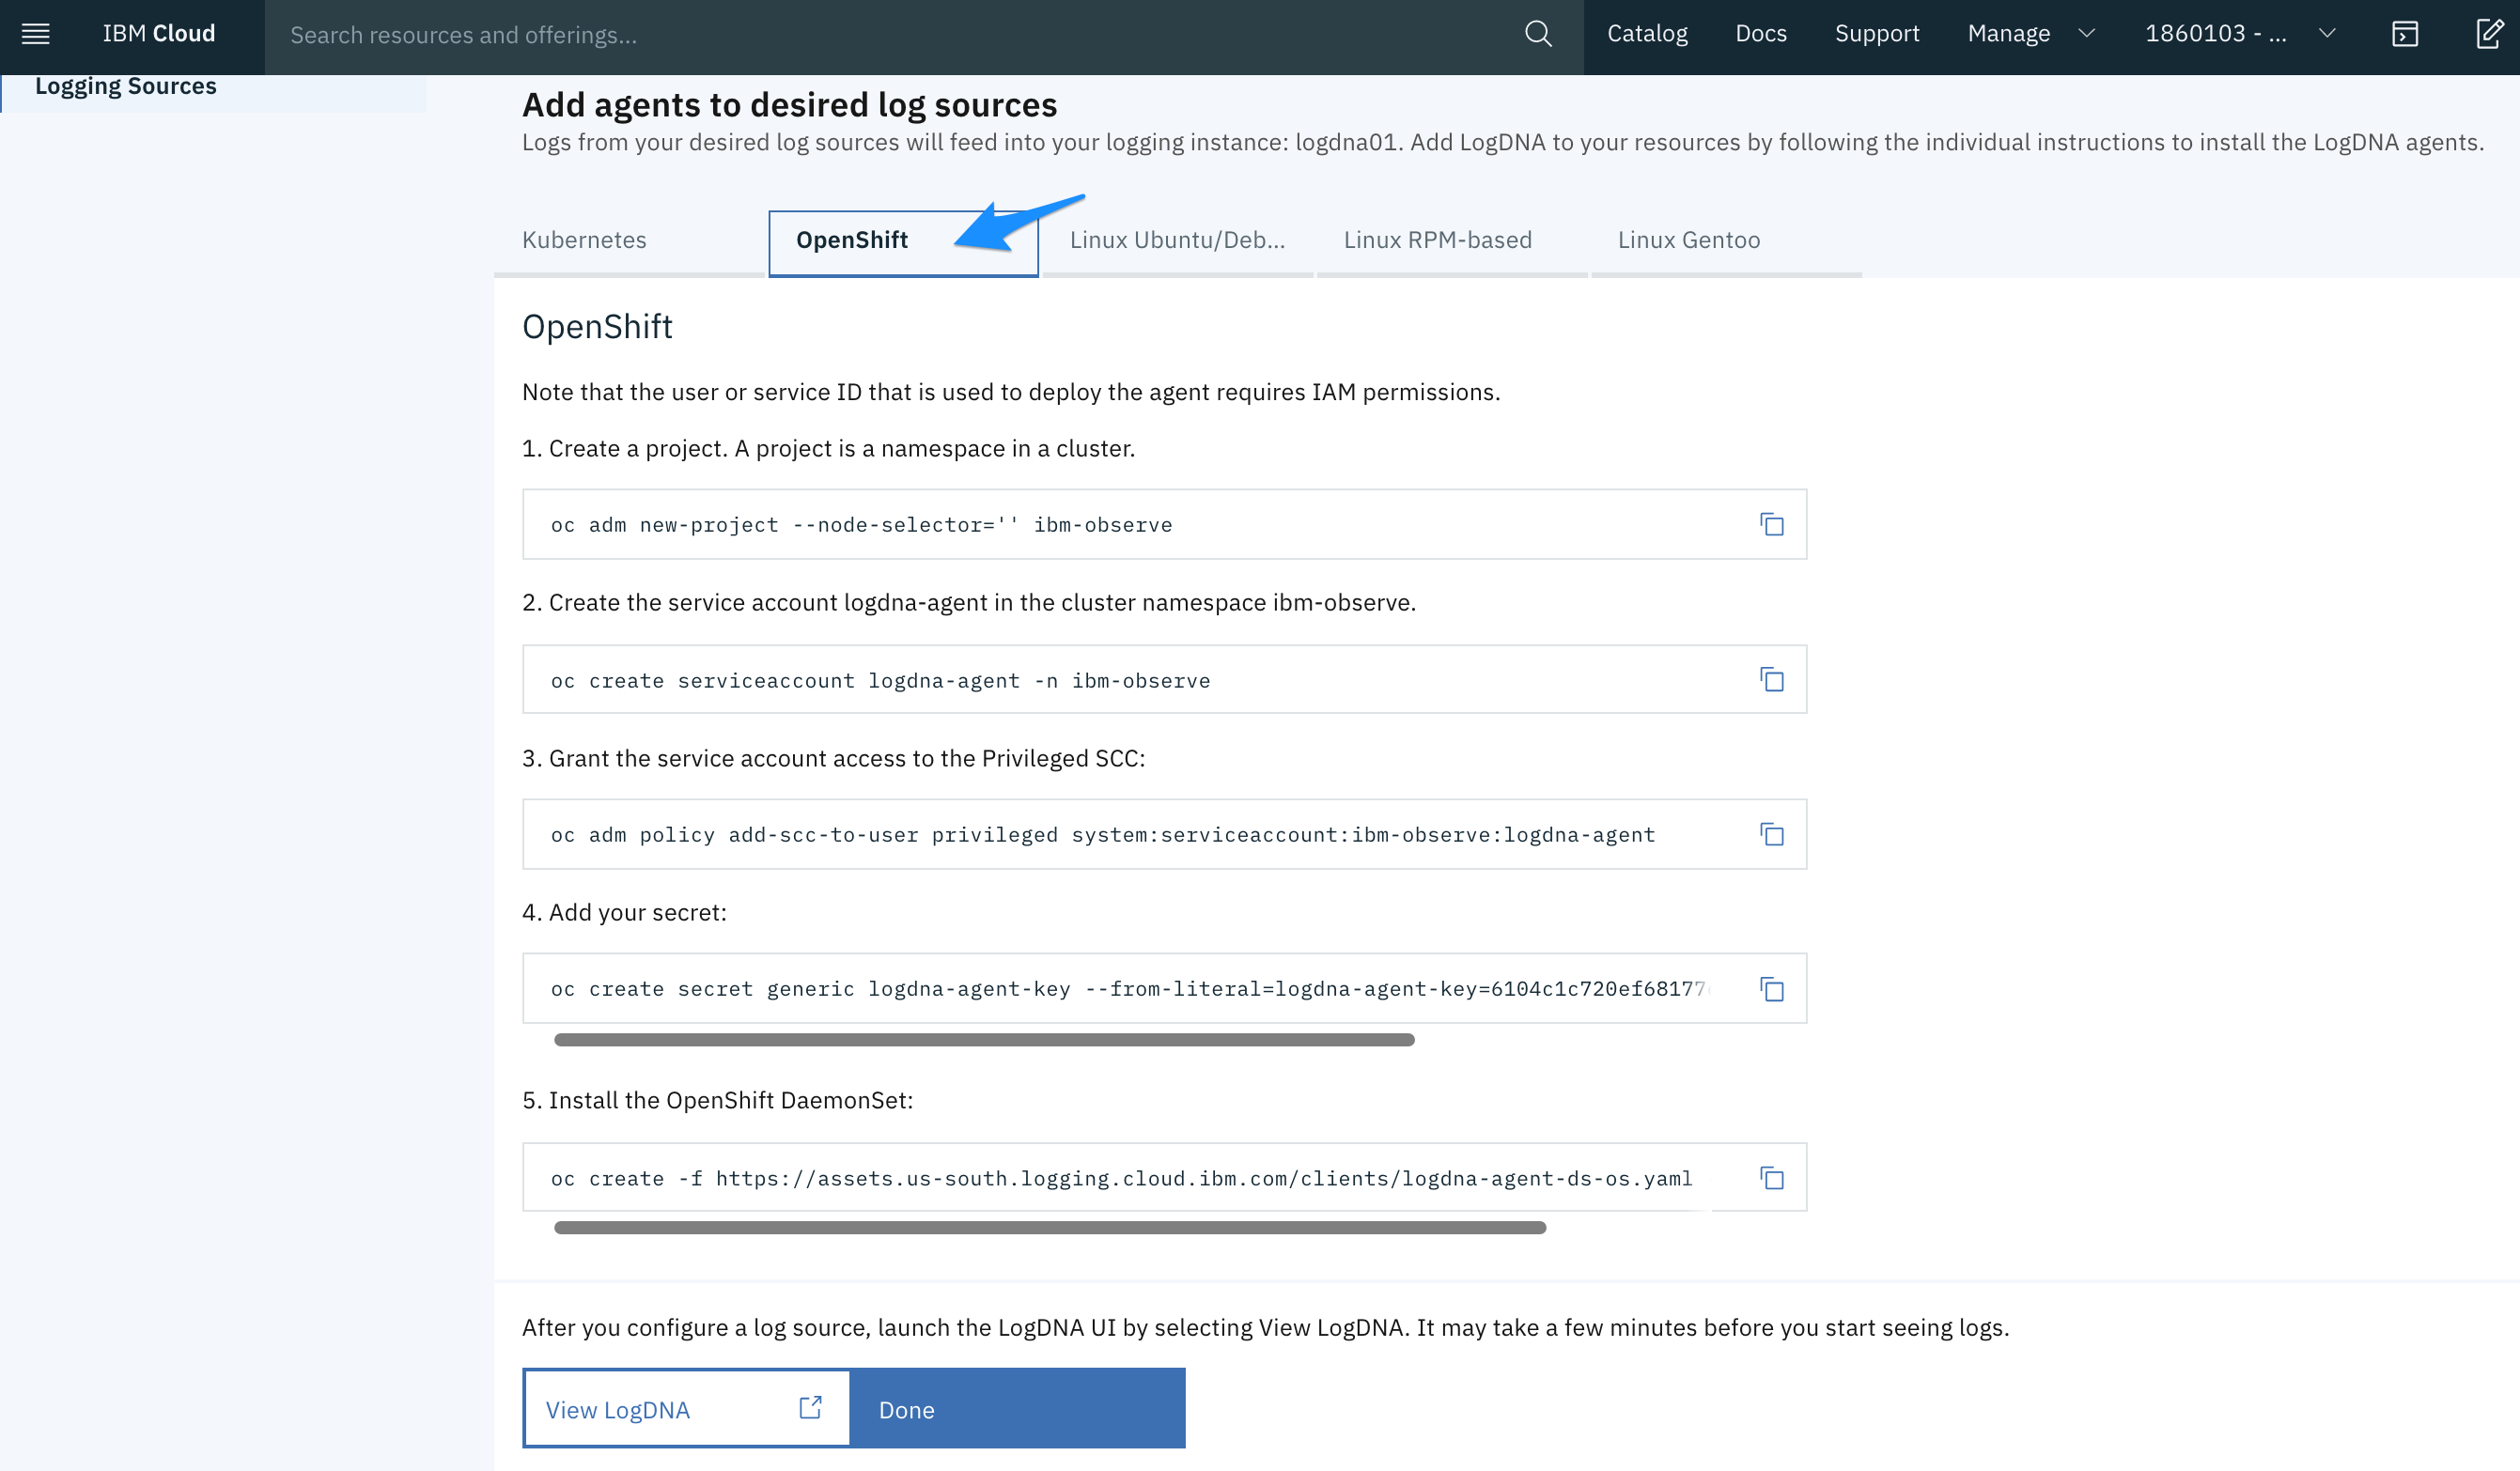
The LogDNA agent collects logs with the extension
*.logand extensionsless files that are stored in the/var/logdirectory of your pod. By default, logs are collected from all namespaces, includingkube-system, and automatically forwarded to the IBM Log Analysis with LogDNA service.
Verify that the LogDNA agent is deployed successfully
To verify that the LogDNA agent is deployed successfully, run the following command:
Target the project where the LogDNA agent is deployed.
oc project ibm-observeVerify that the
logdna-agentpods on each node are in a Running status.oc get pods -n ibm-observe
The deployment is successful when you see one or more LogDNA pods.
- The number of LogDNA pods equals the number of worker nodes in your cluster.
- All pods must be in a
Runningstate. - Stdout and stderr are automatically collected and forwarded from all containers. Log data includes application logs and worker logs.
- By default, the LogDNA agent pod that runs on a worker collects logs from all namespaces on that node.
After the agent is configured, you should start seeing logs from this cluster in the LogDNA web UI. If after a period of time you cannot see logs, check the agent logs.
To check the logs that are generated by a LogDNA agent, run the following command:
oc logs logdna-agent-<ID>
Where ID is the ID for a LogDNA agent pod.
For example,
oc logs logdna-agent-xxxkz